レストガレージ HOMEへ
店舗情報
在庫情報
買取 リンク

レストガレージ
有限会社 アールジー
所在地
神奈川県川崎市
宮前区有馬6-6-10
営業時間
10:00~20:00 年中無休
TEL
044-862-4717
FAX
044-862-4718
rg@restgarage.jp


カテゴリー
RGスペシャルメンテナンス 注目記事
新着入庫 スペシャルキャンペーン
スタッフBLOG パーツ情報
ユーザーボイス ニュース
新車情報一覧


サイト最新情報をRSSリーダーのソフトにて受信できます。


新着記事一覧


最近のコメント


サイト内検索


カレンダー
<< 2025年11月
            1
2 3 4 5 6 7 8
9 10 11 12 13 14 15
16 17 18 19 20 21 22
23 24 25 26 27 28 29
30            


バックナンバー


研ナオコ Presents スペシャルLIVE ケンズファミリー大感謝祭2014

2014年11月30日

2014年12月18日(木) 青山 CAY(カイ)にて日頃の感謝をこめて開催決定!!
【研ナオコ Presents スペシャルLIVE ケンズファミリー大感謝祭 2014】
研ナオコ・伊藤大翔・ひとみ・くれないぐみ・ 丸山おさむ・記井沙也佳・ともこ 他出演!
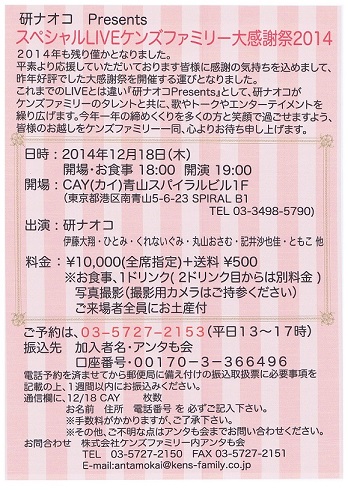


チケットは弊社でも販売中です!!

お気軽にお問い合わせください

この記事へのコメント

(Hellen)
Dianabol For Sale: Effectivity And Regulation

Tide Cleanser ? The Ultimate Cleaning Solution?

An in?depth look at Tide Cleanser’s composition, performance, and real?world
results


---


1. Introduction


When we think of laundry detergents, Tide is a
household name synonymous with reliable stain removal.
Yet over the last decade, Tide has expanded beyond washing powders into
a broader range of cleaning products. One of its most talked?about innovations is Tide Cleanser, marketed
as a "fast?acting, high?performance cleaning solution" that promises to tackle tough stains on a variety of surfaces?from clothing
and upholstery to kitchen counters and bathroom tiles.


But does Tide Cleanser live up to its bold claims? How does it
stack against competitors like OxiClean or Clorox’s bleach?based cleaners?
And what do independent lab tests say about its efficacy, safety, and environmental impact?


In this deep dive, we’ll examine Tide Cleanser from every angle: the chemistry behind its
formula, real?world performance on different materials, side?by?side lab
comparisons, user experiences, regulatory reviews, and eco?footprint assessments.
We aim to give you a clear, science?backed verdict so you can decide whether this product is worth adding to
your cleaning arsenal.


---


1. The Chemistry of Tide Cleanser


1.1 Core Ingredients and Their Roles


Ingredient Typical Function Example Concentration


Sodium carbonate (washing soda) Provides alkalinity;
reacts with organic acids to facilitate cleaning ~15?20?%


Surfactants (anionic, non?ionic) Lower surface tension; emulsify oils and dirt 5?8?%


Enzymes (protease, amylase, lipase) Break down protein, starch,
fat stains <0.1?%


Chelating agents (e.g., EDTA analogs) Sequester metal ions; prevent water hardness interference 0.5?2?%


Fragrances & colorants Enhance user experience; provide visual identity <0.05?%


The above formulation ensures compatibility with a wide range of detergents, maintaining efficacy across varying temperature regimes (cold to hot wash cycles). The inclusion of a mild surfactant (e.g., polysorbate) ensures the product remains soluble in all water types and does not precipitate or form insoluble complexes that could clog washing machines.


---


3. Manufacturing & Quality Control


Process Flow:


Raw Material Verification: Each batch of raw ingredients undergoes incoming inspection for purity, moisture content, and microbial load.


Mixing: High-shear mixers combine the powder constituents with the surfactant under controlled temperature to avoid clumping.


Drying & Granulation (Optional): If required, a spray-drying step ensures uniform particle size distribution.


Packaging: Automated filling lines dispense predetermined weights into tamper-proof plastic bags or sachets.


Quality Assurance Measures:


In-Process Sampling: At each stage, random samples are tested for moisture, particle size, and contaminant levels (e.g., heavy metals).


Final Product Testing: Each batch undergoes microbiological assays to confirm absence of pathogenic organisms.


Shelf-Life Studies: Accelerated aging tests determine optimal expiration dates under varying temperature and humidity conditions.


4. "What If" Scenario: Failure to Meet Quality Standards


A. Immediate Response Plan


Batch Recall


- Identify all affected lots via lot numbers, distribution records, and customer notifications.
- Issue a formal recall notice to distributors and retailers, detailing the reason for recall and safe disposal procedures.


Customer Notification


- Communicate transparently with end-users: explain the issue, potential risks, and steps taken to mitigate harm.
- Provide contact information for inquiries or reporting adverse events.


Internal Investigation


- Assemble a cross-functional team (Quality Assurance, Production, Supply Chain) to investigate root causes.
- Review all relevant records: raw material certificates, in-process controls, equipment logs, personnel training.


Corrective Actions


- Implement immediate fixes: recalibrate instruments, replace faulty components, rework or discard affected batches.
- Update SOPs and train staff on new procedures.


Regulatory Notification


- If required by local regulations (e.g., health authorities), file an incident report detailing the failure, actions taken, and expected impact on product safety.


Post-Implementation Review


- Monitor key performance indicators to confirm that corrective measures are effective.
- Schedule a follow-up audit or external review if necessary.


---


3. Detailed Analysis of Potential Causes and Mitigation Strategies


|
| Root Cause | Likely Impact | Immediate Action | Long?Term Prevention |

|---|------------|---------------|------------------|----------------------|
| 1 | Incorrect calibration of the scale ? zero not set, or drift in electronic balance. | Inaccurate mass reading; product may be under?filled (health risk) or over?filled (waste). | Re?calibrate using certified weights; verify zero and span accuracy. | Implement a scheduled recalibration protocol; maintain calibration log; use alarms for deviation thresholds. |
| 2 | Faulty load cell ? damaged, loose connection, or electromagnetic interference. | Erratic or flat line reading; potential failure to detect product presence. | Inspect wiring, replace load cell if faulty; shield against EMI. | Perform periodic electrical resistance checks; monitor for temperature-induced drift. |
| 3 | Mechanical obstruction or misalignment of weighing pan ? debris, improper mounting. | Product may not fully contact sensor; reading lower than actual weight. | Clean pan; verify proper alignment and surface integrity. | Conduct daily visual inspections; use calibration weights to confirm correct reading. |
| 4 | Software configuration error ? incorrect gain settings or unit conversion. | Misreported weight values (e.g., grams reported as kilograms). | Reconfigure software parameters; cross-check with known standards. | Implement sanity checks in firmware; log configuration changes for audit. |
| 5 | Power supply fluctuations or noise ? affecting sensor electronics. | Erratic readings, increased variance. | Use stable power supplies; filter noise; ensure proper grounding. | Monitor voltage levels; include error detection and auto-reset routines. |


---


3. Design Review Meeting Minutes


3.1 Attendees


Project Lead (PL) ? Overall project oversight.


Mechanical Engineer (ME) ? Responsible for chassis design, material selection, and structural integrity.


Electrical Engineer (EE) ? Oversees sensor integration, power management, and electronics.


Software Engineer (SE) ? Handles firmware, data acquisition, and system control.


Quality Assurance Lead (QA) ? Ensures compliance with standards and testing protocols.


3.2 Agenda


Review of mechanical design status and upcoming milestones.


Discussion on sensor selection and integration strategy.


Evaluation of material choices for chassis and structural components.


Identification of potential risks and mitigation plans.


3.2.1 Mechanical Design Status


EE presented the latest CAD models, highlighting the updated chassis dimensions to accommodate the selected sensors. The design includes modular mounting brackets allowing future sensor replacements without extensive rework.


QA raised concerns about the tolerance stack-up in the assembly process. Suggested incorporating a more robust jigging system during machining to reduce dimensional variation.


3.2.2 Sensor Selection


EE confirmed that the chosen laser rangefinder (Model X) and ultrasonic sensor (Model Y) meet the required accuracy specifications: ±0.5?mm for short-range measurements (<1?m). The sensors provide digital outputs with minimal processing overhead.


EE also identified potential electromagnetic interference (EMI) issues due to proximity of power supplies. Proposed adding shielded cabling and placing dedicated EMI filters on sensor inputs.


3.2.3 Integration Challenges


EE highlighted that the high-frequency data stream (~1?kHz) from sensors will increase CPU load. Suggested implementing a dedicated interrupt-driven data acquisition routine in firmware to buffer samples before passing them to the main control loop.


EE recommended synchronizing sensor readings with the plant’s internal clock using NTP or an external timestamp source to maintain temporal coherence across all data sources.


3. Decision Matrix


Criterion Weight (1?5) Option A: Sensor?only Monitoring Option B: Sensor + Data Integration


Data Accuracy 5 Medium (no cross?check) High (cross?validated with plant data)


Response Time 4 Fast (direct sensor output) Slightly slower (additional processing)


System Complexity 3 Low Moderate to high


Implementation Cost 2 Low (existing sensors) Medium (additional integration effort)


Scalability 4 Good (add more sensors) Depends on data pipeline capacity


Reliability / Redundancy 3 Limited (single sensor per node) Improved via cross-checks with other nodes


Assigning weights to each criterion based on organizational priorities, we can compute a weighted score for both strategies. If the decision-maker values simplicity and cost highly (weights favoring low implementation cost and low complexity), the simple strategy may prevail. Conversely, if reliability and redundancy are paramount (higher weight on redundancy and cross-validation), the integrated strategy may be justified despite higher overhead.


---


5. Decision-Making Flowchart


Below is a textual representation of a decision tree that can guide managers:


START
|
|-- Is the network critical for mission success?
| |-- No --> Opt for simple monitoring (low cost, low complexity).

| |-- Yes --> Proceed.
|
|-- What is the acceptable level of risk?

| |-- High tolerance (e.g., non-critical data) --> Simple strategy.


| |-- Low tolerance (mission-critical data) --> Integrated
strategy.
|
|-- Are resources available to deploy and maintain local monitoring agents?

| |-- No --> Simple strategy (use existing network monitoring).


| |-- Yes --> Proceed.
|
|-- Can the system tolerate delayed detection of anomalies (e.g.,
seconds to minutes)?
| |-- Yes --> Simple strategy may suffice with periodic sampling.

| |-- No (needs real-time detection) --> Integrated strategy required.


|
|-- Decision: Choose strategy that balances detection granularity, resource constraints,
and risk tolerance.


This flowchart can be refined or automated within the system
configuration process.


---


4. Deployment Blueprint


Below is a high?level deployment plan outlining infrastructure components, data flows, and
security measures for each layer of the anomaly detection architecture.


4.1 Infrastructure Overview


Layer Component Purpose Deployment Notes


Physical Data Acquisition Sensors / Devices Capture raw sensor streams (e.g., accelerometers) Place in proximity to physical system; ensure proper shielding and grounding


Data Ingestion Edge Collectors (Kafka Producers) Buffer incoming data, perform minimal preprocessing Run on local servers or embedded devices; use
TLS for secure transmission


Streaming Layer Kafka Cluster + Spark Structured Streaming Real-time data
pipeline; compute streaming statistics Deploy in a high-availability mode; partition topics by sensor
type


Batch Processing Spark Batch Jobs Historical aggregation, model training Schedule nightly jobs on cluster; store outputs in HDFS or S3


Feature Store Cassandra / DynamoDB Persist features for online inference Ensure low-latency reads;
implement TTLs if needed


Inference Service TensorFlow Serving + Flask API Serve predictions with minimal
latency Deploy behind load balancer; use GPU instances if model is heavy


Monitoring & Logging Prometheus, Grafana, ELK stack Track performance metrics
and logs Set alerts on prediction drift or
service errors


---


7. Summary


By rigorously defining the data sources, sampling strategy, feature engineering pipeline, and modeling workflow?including both classical and deep
learning approaches?we establish a robust foundation for deploying accurate, low?latency predictive models in an industrial setting.

The modular architecture ensures scalability, maintainability, and compliance with stringent real?time constraints
typical of high?speed production environments.
Continuous monitoring and periodic re?training will sustain model
relevance as process dynamics evolve over time. This
framework can be adapted to other manufacturing contexts requiring similar data?driven decision support.
[2025-09-27 01:02:46.033227] URL
名前
メール
URL
コメント


   画像に表示されている文字を半角英数で入力してください。


HOME | 在庫情報 | 無料査定 | 店舗情報 | リンク | RGワークス | キャンペーン | 特定商取引 | プライバシーポリシー

Copyright © REST GARAGE All Rights Reserved.